Two weeks ago, I tried to explain what the proper definitions are for a top six forward. What we learned was that if your top six forward does not give you 20 goals plus 25 assists if you’re player is a winger or 35 assists if they’re a center, does not mean your player is not a top six forward. However, it all depends on how one interprets the definition of a top six forward, especially if you are a fan of a team looking for a Stanley Cup in the near future. What really matter is that the goal for your team is to collect as many of these top-60 forwards in their respective position as you can. If you collect any of them that consistently hit the top-32, that is fantastic, but it is not the end of the world. The final lesson learned is the growing importance of stacking your team with centers. Tables and graphs showed that since the league experienced its last year of a 27-team regular season in 1999, the center position has become more and more valuable. As we learned from prevalent Capitals blogger Kareem El-Alally, these types of forwards are one of the biggest reasons why teams win championships, but he also mentioned one other thing: you can’t win a cup without defencemen.
So that is what we will look into this week. Before we dive in, I have some questions I need to ask you. Would you prefer PK Subban or Hal Gill? How about Mike Green or Karl Alzner? Finally, what about Brian Leetch or Tim Horton? Clearly, this assignment seemed a little tough because not all defenceman are created equal as they all have different playing styles. Some can drop back and either block shots or lay down major hits along the boards, while others join the rush and get involved in the offensive zone. Some are the quarterbacks of the power play, while others are quarterbacks of the penalty kill. Ideally, you want your defenceman to have the entire package. However, the best defencemen in hockey play over 20-25 minutes and unless they develop the endurance to win marathons anytime soon, they can’t do it all.
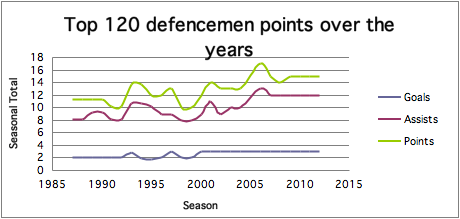
However, if one were to look at the last 25 seasons, you will notice that there are some bare minimum requirements. We start defining top four defencemen as those that are in the top two defensive pairings. In other words, the best two lines with two defencemen each gives you your teams best four defencemen. If we multiply that by 30 teams currently in the NHL, we will be looking for the top-120 defencemen in the entire league. If we multiply by 16 teams that make the Stanley Cup playoffs instead, we will be looking for the top-64 defencemen. Like the top six forward post, these numbers will be pro-rated for an 82-game regular season across the board. This is because the NHL had 80 game regular seasons from 1987-1992, to 84 games in 1993-194 and the infamous 48 game lockout of 1995 and soon to be 2013. After looking at those last 25-seasons, here is the data required in order to make the top-120.
| Defencemen | Point Shares | |||||
| Top 120 | G | A | Pts | OPS | DPS | PS |
| 2012 | 3 | 12 | 15 | 0.7 | 2.4 | 3.2 |
| 2011 | 3 | 12 | 15 | 0.5 | 2.6 | 3.2 |
| 2010 | 3 | 12 | 15 | 0.6 | 2.5 | 3.3 |
| 2009 | 3 | 12 | 15 | 0.5 | 2.5 | 3.1 |
| 2008 | 3 | 12 | 14 | 0.5 | 2.7 | 3.2 |
| 2007 | 3 | 12 | 15 | 0.5 | 2.5 | 3.3 |
| 2006 | 3 | 13 | 17 | 0.5 | 2.5 | 3.3 |
| 2004 | 3 | 10 | 13 | 0.6 | 2.6 | 3.2 |
| 2003 | 3 | 10 | 13 | 0.5 | 2.5 | 2.9 |
| 2002 | 3 | 9 | 13 | 0.5 | 2.5 | 3.3 |
| 2001 | 3 | 11 | 14 | 0.5 | 2.4 | 3.1 |
| 2000 | 3 | 9 | 12 | 0.4 | 2.3 | 2.8 |
| 1999 | 2 | 8 | 10 | 0.3 | 2.1 | 2.1 |
| 1998 | 2 | 8 | 10 | 0.2 | 2.7 | 3.1 |
| 1997 | 3 | 9 | 13 | 0.3 | 2.7 | 3.1 |
| 1996 | 2 | 9 | 12 | 0.2 | 2.6 | 3.2 |
| 1995 | 2 | 10 | 12 | 0.2 | 2.7 | 3.1 |
| 1994 | 2 | 11 | 14 | 0.2 | 2.7 | 3.1 |
| 1993 | 3 | 11 | 14 | 0.1 | 2.4 | 2.8 |
| 1992 | 2 | 8 | 10 | 0.0 | 2.2 | 2.3 |
| 1991 | 2 | 8 | 10 | 0.0 | 2.3 | 2.4 |
| 1990 | 2 | 9 | 11 | 0.0 | 2.2 | 2.3 |
| 1989 | 2 | 9 | 11 | 0.0 | 2.2 | 2.2 |
| 1988 | 2 | 8 | 11 | 0.1 | 1.9 | 2.2 |
| 1987 | 2 | 8 | 11 | 0.0 | 2.4 | 2.5 |
| AVERAGE | 3 | 10 | 13 | 0.3 | 2.4 | 2.9 |

Now, here is the data to make the top-64.
| Defencemen | Point Shares | |||||
| Top 64 | G | A | Pts | OPS | DPS | PS |
| 2012 | 5 | 19 | 24 | 1.6 | 3.5 | 4.8 |
| 2011 | 5 | 20 | 26 | 1.6 | 3.6 | 5.0 |
| 2010 | 6 | 20 | 26 | 1.6 | 3.6 | 5.1 |
| 2009 | 6 | 21 | 26 | 1.7 | 3.8 | 5.1 |
| 2008 | 5 | 18 | 24 | 1.6 | 3.5 | 5.0 |
| 2007 | 6 | 21 | 25 | 1.4 | 3.7 | 5.0 |
| 2006 | 6 | 21 | 28 | 1.6 | 3.8 | 5.2 |
| 2004 | 6 | 18 | 24 | 1.6 | 3.6 | 5.1 |
| 2003 | 5 | 17 | 22 | 1.4 | 3.6 | 4.9 |
| 2002 | 5 | 18 | 24 | 1.4 | 3.8 | 5.1 |
| 2001 | 5 | 17 | 22 | 1.4 | 3.6 | 4.8 |
| 2000 | 5 | 19 | 24 | 1.3 | 3.6 | 4.8 |
| 1999 | 5 | 15 | 20 | 1.1 | 3.1 | 4.5 |
| 1998 | 5 | 17 | 22 | 1.2 | 3.9 | 5.2 |
| 1997 | 5 | 17 | 22 | 1.1 | 3.8 | 4.9 |
| 1996 | 5 | 18 | 23 | 1.1 | 3.9 | 4.8 |
| 1995 | 5 | 19 | 24 | 1.2 | 3.8 | 4.8 |
| 1994 | 6 | 20 | 26 | 1.3 | 3.8 | 4.9 |
| 1993 | 6 | 21 | 26 | 1.1 | 3.7 | 5.0 |
| 1992 | 5 | 18 | 23 | 0.9 | 3.6 | 4.2 |
| 1991 | 5 | 17 | 24 | 0.8 | 3.5 | 4.1 |
| 1990 | 4 | 17 | 22 | 0.6 | 3.5 | 4.2 |
| 1989 | 4 | 18 | 22 | 0.6 | 3.5 | 4.3 |
| 1988 | 6 | 21 | 26 | 1.0 | 3.5 | 4.3 |
| 1987 | 6 | 19 | 25 | 1.0 | 3.5 | 4.0 |
| AVERAGE | 5 | 19 | 24 | 1.3 | 3.6 | 4.8 |
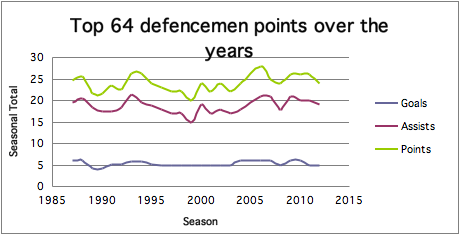

Before I continue, you might have noticed that in both my forwards post and this defencemen post, all point share totals increase until 2000 when they reach a steady state. This makes sense as the NHL went from 21 teams in 1987, to 22 in 1992, 24 in 1993, 26 in 1994, 27 in 1999, 28 in 2000 and the 30 we know in love in 2001. As a result, being considered the 120th best defenceman in the NHL in say 2004 is much more valuable than in 1987. However, being the 120th best defencemen in 2004 could be as valuable as being the 84th best defencemen in 1987. But what makes this data amazing is that goals, assists and points have stayed relatively constant throughout every season, no matter how many teams are in the league. This goes to show how deep the talent pool was back when the league was much smaller. So did Gary Bettman and his NHL front office buddies go to far in expansion (hello Phoenix and Florida)? Take a look at this interesting chart as potential proof.

As you can see, your “offensive defencemen” types are getting rarer since the 1995 lockout while the “stay at home defencemen” types are ruling the days in the NHL. As you can see with the top-64 and top-120 data though, defencemen of all types still need to join in on the rush and move the puck in some capacity. They do not need to score goals, but the assist totals for both a top-64 and top-120 defencemen have to be comparable to a top-60 winger. The comparisons between the two groups we used for our definition of top four defencemen is that it takes an extra couple of goals and roughly ten assists to get from the top-120 to the top-64 every year.
Sounds like we’re done, right? Not so fast! As I mentioned two weeks ago, defensive point shares are assumed to be a terrible statistic to measure the quality of a top six forward’s defensive play. Some lead the league when they should not while data shows that only tenths of a point separate the top-32 to the top-60. However, the lack of goal scoring for a top-64 or top-120 blueliner flip the script as to how we have to take defensive point shares seriously for them. So we ask once again, is defensive point shares a trustworthy statistic? Let’s review the formula used from the source, hockey-reference.com. For the review of the formula, I will use the man who is on my replica jersey, John Carlson. Feel free to do this yourself by using the following sources if you want to waste your life have some fun.
The first thing to do is divide John Carlson’s time on the ice with the entire team’s time on the ice
- 54,900 seconds/692,580 seconds = .079269
Next, we calculate the proportion of the Capitals’ marginal goals against under Carlson’s watch.
- (7-2*((1,231 shots against/2,349 total minutes)/(#16,675 league-wide shots/#37,058 league-wide minutes))/7 = 0.667246
- # = algebraically calculated using the following source.
Next, we assume the position adjustment ratio for John Carlson is 10/7 since he is a defenceman. This is a potential red flag as hockey-reference.com has not shown why we need to have a positional adjustment for the defensive point shares formula.
As we continue, the next step is to figure out the Capitals’ marginal team goals against.
- (1+(7/12)) * (39 team games)*(2.74 league-wide average team goals per game) – (110 goals against) = 59.195 marginal team goals
Next up, we figure out John Carlson’s adjusted plus/minus.
- (1/7)*(10/7 for positional adjustment)*((+5)-(54900 seconds)*((+10 among all Caps denfencemen)/(271,920 seconds among all Caps defencemen))) = +0.608372
Slowly but surely, things are coming together as the next step is to calculate John Carlson’s marginal goals against.
- (0.079269)*(0.667246)*(10/7 for positional adjustment)*(59.195 marginal team goals) + (0.608372 adjusted +/-) = 5.08114
On the second to last step, we calculate the league wide marginal goals per standings point.
- 3152 league-wide goals/1285 total standings points as the beginning of April 8th = 2.46 goals/standings point
Finally, we discover John Carlson’s defensive point shares.
- 5.08114/2.46 = 2.1 DPS!!!!
So what was learned is that the formula takes into account how well players perform compared to other players on their team in their respective positions. This is definitely what we want as defenceman, centers and wingers have different defensive roles to play. However, that positional adjustment constant really disturbs me considering that the very number for forwards is only 5/7. At the end of the day, one player may make a mistake to lead to a goal against, but their are always five skaters with roughly the same stick length and objective to prevent a goal from being scored. Also, defencemen do have more ice time than forwards, but it’s not as much as this formula makes it out to be. If say, a Ryan Callahan has those very numbers used in the formula above instead of a John Carlson, he would get 1.1 defensive point shares. As a result, look at Callahan’s numbers for this year! Using our very eyes to watch hockey games, does that make sense? Didn’t think so.
Sure, this was a chore to discover, but this is an important topic because 75-85% of defencemen’s total point shares come from the defensive part of the equation. So in conclusion, defensive point shares are a great starting point, but other stats have to be discovered (fenwick, corsi, etc.) in order to find what the real metrics are to find the definition of what a top four defenceman is.
Once again…and again, I would like to thank hockey-reference.com for this research.
