The first list of players are Sergei Fedorov, Brendan Morrison, Jason Arnott and now, Mike Ribeiro. They have been temporary answers in the last five years for the Washington Capitals’ question as to who will play the second line center position but not long term solutions. The next list contains Tomas Fleischmann and Alexander Semin. These are top of the line wingers whose agents over-hyped them, yet media members constantly bashed (hey, let’s forget that hockey can be unintentionally racist, but that’s another subject for another time). Before you know it, they become great finds for the other teams and the general public is shocked why the Caps let them go in the first place.
Clearly, top six forwards are the most important players on a hockey team that wants to win a Stanley Cup. They are the most counted on to put the goals on the scoreboard and are counted on to have the puck on the stick when things get tight. They are looked up to by teammates and fans and they almost can never have a bad night. If they do, the worst GM in the NHL’s modern era media experts will hound you like there is no tomorrow.
So what is a top six forward? Let’s make a basic definition of what that is. Since a hockey team employs four lines of 12 forwards on any given game, being a top six forward means that you need to be in the top two lines. Yes, I know, many of you hockey fans know this, but it gets better, I promise. Since their are 30 teams in the NHL, that means one needs to be in the top 60 in their respective forward position in order to be considered a top six forward, right?
| Left Wing | Point Shares | Center | Point Shares | Right Wing | Point Shares | |||||||||||||
| Top 60 | G | A | Pts | Off | Def | Tot | G | A | Pts | Off | Def | Tot | G | A | Pts | Off | Def | Tot |
| 2012 | 10 | 13 | 24 | 1.3 | 0.9 | 1.8 | 17 | 26 | 43 | 3.2 | 1.5 | 4.7 | 7 | 12 | 18 | 0.7 | 0.9 | 1.7 |
| 2011 | 12 | 15 | 27 | 1.7 | 1.0 | 2.6 | 17 | 26 | 42 | 2.7 | 1.4 | 4.1 | 11 | 13 | 23 | 1.2 | 0.9 | 2.1 |
| 2010 | 11 | 11 | 23 | 1.1 | 1.0 | 2.0 | 17 | 26 | 42 | 2.9 | 1.4 | 4.3 | 11 | 14 | 27 | 1.6 | 1.0 | 2.5 |
| 2009 | 13 | 16 | 29 | 1.5 | 1.0 | 2.5 | 15 | 24 | 41 | 2.4 | 1.3 | 3.7 | 14 | 17 | 32 | 2.0 | 1.0 | 3.1 |
| 2008 | 13 | 16 | 29 | 1.8 | 1.1 | 2.9 | 14 | 24 | 38 | 2.3 | 1.3 | 3.7 | 12 | 15 | 30 | 1.7 | 0.9 | 2.7 |
| 2007 | 11 | 13 | 26 | 0.9 | 0.9 | 1.7 | 17 | 26 | 42 | 2.9 | 1.4 | 4.2 | 13 | 17 | 30 | 1.4 | 0.9 | 2.4 |
| 2006 | 12 | 17 | 29 | 1.3 | 1.0 | 2.3 | 16 | 25 | 42 | 2.4 | 1.3 | 3.7 | 14 | 18 | 32 | 1.7 | 1.1 | 2.8 |
| 2004 | 12 | 16 | 28 | 1.8 | 1.2 | 3.0 | 13 | 22 | 35 | 2.1 | 1.2 | 3.4 | 13 | 15 | 29 | 2.1 | 1.1 | 3.0 |
| 2003 | 13 | 17 | 30 | 1.7 | 1.1 | 2.8 | 13 | 23 | 39 | 2.4 | 1.2 | 3.7 | 11 | 16 | 27 | 1.4 | 1.0 | 2.3 |
| 2002 | 13 | 16 | 31 | 1.7 | 1.1 | 2.7 | 13 | 23 | 37 | 2.2 | 1.3 | 3.4 | 11 | 16 | 27 | 1.4 | 1.1 | 2.4 |
| 2001 | 13 | 18 | 32 | 1.7 | 1.2 | 2.8 | 13 | 22 | 32 | 1.8 | 1.3 | 3.1 | 13 | 18 | 31 | 1.7 | 1.1 | 2.7 |
| 2000 | 11 | 13 | 25 | 1.0 | 0.9 | 1.9 | 14 | 22 | 37 | 2.1 | 1.3 | 3.4 | 12 | 20 | 32 | 1.8 | 1.1 | 2.9 |
| 1999 | 8 | 11 | 21 | 0.8 | 0.7 | 1.6 | 14 | 24 | 39 | 2.2 | 1.2 | 3.6 | 11 | 17 | 28 | 1.6 | 1.0 | 2.6 |
| 1998 | 11 | 14 | 25 | 1.4 | 0.8 | 2.1 | 11 | 18 | 27 | 1.3 | 1.1 | 2.2 | 11 | 15 | 25 | 1.6 | 0.8 | 2.2 |
| 1997 | 12 | 16 | 29 | 1.4 | 0.9 | 2.2 | 12 | 20 | 32 | 1.4 | 0.8 | 2.4 | 12 | 17 | 30 | 1.3 | 0.8 | 2.0 |
| 1996 | 13 | 16 | 30 | 1.1 | 0.8 | 2.0 | 13 | 20 | 32 | 1.3 | 0.8 | 2.3 | 14 | 17 | 29 | 1.1 | 0.8 | 1.7 |
| 1995 | 12 | 14 | 27 | 1.0 | 0.9 | 1.9 | 12 | 21 | 36 | 1.9 | 0.9 | 2.9 | 14 | 15 | 29 | 1.2 | 0.9 | 2.2 |
| 1994 | 13 | 17 | 28 | 1.0 | 0.8 | 2.0 | 14 | 21 | 34 | 1.4 | 0.8 | 2.1 | 13 | 18 | 30 | 1.2 | 0.9 | 2.1 |
| 1993 | 11 | 14 | 26 | 0.4 | 0.8 | 1.2 | 13 | 20 | 32 | 1.0 | 0.7 | 1.7 | 14 | 17 | 31 | 1.1 | 0.8 | 1.8 |
| 1992 | 8 | 13 | 22 | 0.4 | 0.7 | 0.9 | 12 | 21 | 31 | 0.9 | 0.6 | 1.5 | 11 | 16 | 30 | 0.9 | 0.7 | 1.6 |
| 1991 | 11 | 14 | 26 | 0.6 | 0.7 | 1.3 | 11 | 19 | 32 | 0.9 | 0.8 | 1.6 | 10 | 12 | 25 | 0.5 | 0.6 | 1.3 |
| 1990 | 12 | 14 | 27 | 0.4 | 0.7 | 1.3 | 11 | 17 | 30 | 0.9 | 0.6 | 1.5 | 11 | 15 | 27 | 0.2 | 0.7 | 1.1 |
| 1989 | 12 | 16 | 30 | 0.6 | 0.6 | 1.4 | 13 | 21 | 36 | 1.1 | 0.7 | 1.7 | 10 | 11 | 26 | 0.2 | 0.6 | 0.8 |
| 1988 | 10 | 13 | 23 | 0.4 | 0.6 | 1.1 | 11 | 21 | 34 | 1.0 | 0.7 | 1.8 | 10 | 13 | 25 | 0.3 | 0.6 | 0.9 |
| 1987 | 11 | 15 | 27 | 0.3 | 0.7 | 1.0 | 14 | 24 | 40 | 1.3 | 0.7 | 2.1 | 12 | 15 | 27 | 0.3 | 0.7 | 1.0 |
Sure? 367 left wingers, 295 centers and 335 right wingers have hit the 25-year average point totals in at least one season. That’s actually not a huge amount once you sit down and think about it. However, if we were to look at this metric, Marcus Johansson should be a second line center, while Joel Ward should be a second line right winger from the 2012 seasons point totals. Is this right? Doesn’t sound like it, and that’s ok. That is because we need to take into account that for every Sidney Crosby, there is a Derick Brassard. In other words, we need to take into account that bad teams will have bad forwards playing in top six positions that don’t deserve it and great teams have great forwards playing in much small roles than they deserve (speaking of Tomas Fleischmann…).
So let’s change the original definition of a top six forward. Since 16 teams make the Stanley Cup playoffs every year, lets make a top six forward on a good team hit point totals that will make the top 32 in their respective forward positions. Here is what we get.
| Left Wing | Point Shares | Center | Point Shares | Right Wing | Point Shares | |||||||||||||
| Top 32 | G | A | Pts | Off | Def | Tot | G | A | Pts | Off | Def | Tot | G | A | Pts | Off | Def | Tot |
| 2012 | 19 | 24 | 45 | 3.6 | 1.3 | 4.9 | 22 | 34 | 55 | 4.7 | 2.0 | 6.4 | 20 | 24 | 44 | 3.7 | 1.5 | 5.1 |
| 2011 | 20 | 24 | 46 | 3.6 | 1.5 | 5.2 | 21 | 32 | 56 | 4.5 | 1.8 | 6.5 | 20 | 25 | 46 | 3.6 | 1.4 | 4.8 |
| 2010 | 19 | 23 | 43 | 3.1 | 1.3 | 4.6 | 20 | 34 | 57 | 4.8 | 1.9 | 6.4 | 20 | 23 | 44 | 3.3 | 1.4 | 4.6 |
| 2009 | 22 | 27 | 49 | 3.7 | 1.5 | 5.3 | 22 | 33 | 53 | 3.9 | 1.7 | 5.4 | 22 | 26 | 50 | 3.9 | 1.4 | 5.5 |
| 2008 | 19 | 27 | 47 | 3.7 | 1.6 | 5.2 | 21 | 33 | 54 | 4.0 | 1.7 | 5.4 | 20 | 25 | 42 | 3.4 | 1.5 | 4.8 |
| 2007 | 17 | 24 | 45 | 2.9 | 1.4 | 4.1 | 22 | 37 | 59 | 4.2 | 1.9 | 5.8 | 23 | 27 | 52 | 4.1 | 1.6 | 5.4 |
| 2006 | 22 | 29 | 50 | 3.6 | 1.5 | 5.1 | 23 | 39 | 60 | 4.5 | 1.8 | 6.0 | 23 | 29 | 54 | 4.0 | 1.5 | 5.3 |
| 2004 | 19 | 24 | 43 | 3.4 | 1.6 | 4.8 | 19 | 29 | 47 | 3.7 | 1.7 | 5.4 | 18 | 25 | 45 | 3.7 | 1.5 | 5.2 |
| 2003 | 18 | 23 | 42 | 3.2 | 1.6 | 4.6 | 20 | 33 | 55 | 4.0 | 1.6 | 5.5 | 22 | 25 | 49 | 4.0 | 1.5 | 6.0 |
| 2002 | 20 | 25 | 45 | 3.4 | 1.5 | 5.1 | 20 | 32 | 53 | 4.0 | 1.7 | 5.7 | 20 | 26 | 44 | 3.3 | 1.6 | 4.9 |
| 2001 | 20 | 25 | 45 | 3.0 | 1.6 | 4.9 | 19 | 36 | 53 | 3.8 | 1.6 | 5.1 | 23 | 29 | 49 | 4.0 | 1.5 | 5.2 |
| 2000 | 16 | 21 | 37 | 2.4 | 1.4 | 3.9 | 20 | 36 | 55 | 4.0 | 1.8 | 5.7 | 21 | 26 | 46 | 3.4 | 1.6 | 4.9 |
| 1999 | 16 | 20 | 35 | 2.2 | 1.2 | 3.4 | 20 | 33 | 54 | 3.7 | 1.7 | 5.2 | 18 | 24 | 44 | 3.2 | 1.4 | 4.5 |
| 1998 | 16 | 23 | 36 | 2.9 | 1.0 | 4.0 | 18 | 27 | 44 | 3.6 | 0.8 | 4.5 | 17 | 22 | 41 | 3.1 | 1.1 | 4.0 |
| 1997 | 18 | 23 | 41 | 2.7 | 1.1 | 3.8 | 21 | 32 | 53 | 4.3 | 1.1 | 5.5 | 22 | 25 | 46 | 3.5 | 1.1 | 4.5 |
| 1996 | 22 | 28 | 48 | 3.1 | 1.1 | 4.2 | 20 | 35 | 55 | 3.5 | 1.1 | 4.6 | 23 | 27 | 51 | 3.7 | 1.1 | 4.5 |
| 1995 | 19 | 24 | 43 | 2.7 | 1.2 | 3.8 | 21 | 36 | 58 | 4.3 | 1.2 | 5.1 | 22 | 22 | 44 | 2.9 | 1.2 | 4.1 |
| 1994 | 21 | 26 | 48 | 2.8 | 1.2 | 4.0 | 22 | 34 | 55 | 3.6 | 1.2 | 4.9 | 22 | 28 | 51 | 3.1 | 1.1 | 4.3 |
| 1993 | 20 | 26 | 46 | 2.2 | 1.1 | 3.2 | 23 | 43 | 72 | 4.6 | 1.1 | 5.5 | 26 | 34 | 59 | 3.5 | 1.1 | 4.7 |
| 1992 | 19 | 24 | 41 | 2.1 | 1.0 | 3.4 | 22 | 35 | 57 | 3.6 | 1.0 | 4.6 | 24 | 29 | 57 | 3.6 | 1.0 | 4.1 |
| 1991 | 19 | 24 | 43 | 2.3 | 1.0 | 3.1 | 21 | 32 | 52 | 3.1 | 1.0 | 4.1 | 23 | 23 | 46 | 2.7 | 1.0 | 3.5 |
| 1990 | 23 | 28 | 49 | 2.6 | 1.0 | 3.2 | 24 | 39 | 64 | 3.4 | 0.9 | 4.4 | 23 | 27 | 49 | 2.9 | 1.0 | 3.6 |
| 1989 | 19 | 28 | 45 | 1.9 | 1.0 | 3.0 | 24 | 39 | 64 | 3.5 | 1.1 | 4.7 | 25 | 27 | 52 | 2.8 | 0.9 | 3.4 |
| 1988 | 17 | 26 | 46 | 1.9 | 1.0 | 3.0 | 23 | 38 | 59 | 3.1 | 1.1 | 4.3 | 25 | 27 | 51 | 2.8 | 0.9 | 3.6 |
| 1987 | 19 | 26 | 50 | 2.3 | 0.9 | 3.3 | 23 | 37 | 60 | 3.5 | 0.9 | 4.4 | 23 | 30 | 53 | 3.0 | 1.1 | 4.0 |
Wow! The standards have really gotten tougher. Only 219 left wingers, 155 centers and 173 right wingers have hit this mark at least once in the last 25 years. In other words, that’s really hard for a hockey team to have six forwards with such high point totals every season. You certainly can be a playoff team and not have all six of your forwards hit those marks. So the key is in order to win a Stanley Cup in the salary cap era, you need to collect as many top 60 forwards as possible on your team. The 2012 Phoenix Coyotes example shows that you may not have all six forwards hitting the top 32 marks(three in this case), but having seven and a couple of defensemen hit the top 60 totals sure helps (including Boyd Gordon ladies and gentlemen!!!). Now, let’s look at the trends over the years. Yes my friends, the squiggles are back!
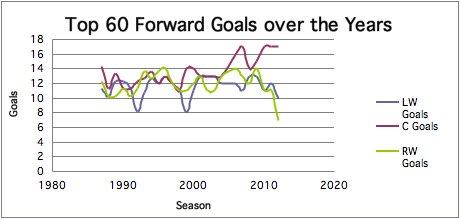
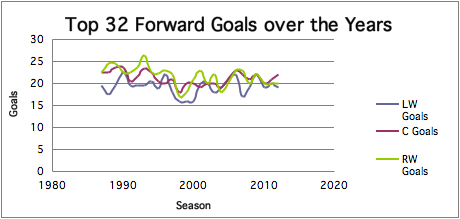
All three positions seem to hit the same goal total marks every year. So we can conclude that all top six forwards somewhere between 8-17 goals to hit the top 60 and 17-26 to hit the top 32. However…


Look at that! Centers are demanded to collect at least 10 more assists than their friends on the wing. So as a result…

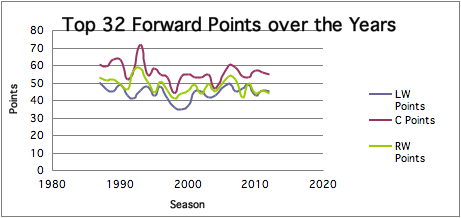
centers have to collect more points than those on the wing. So wingers need to get into the mid 20s in order to hit the top 60 and the mid 40s in order to hit the t0p 32 while centers need to hit the mid 30s to hit the top 60 and the mid 50s to hit the top 32. This leads us to our final two graphs.

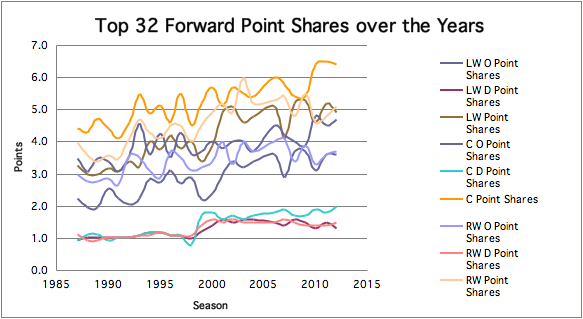
Point shares are a brand new hockey sabermetric that hasn’t hit the mainstream just yet. The objective of point shares is to determine who is the most valuable player with one number, by calculating how many standings points a player can generate for his team in one season. It is almost like how WAR is used for baseball to determine how many wins a player can generate compared to a replacement player for his team.
As you can see so far, defensive point shares may not be the best metric to determine who is the best defensive forward in hockey. Try and use hockey reference for every season and you will see that the numbers are too bunched together and sometimes the player with the most defensive point shares are given to players that do not deserve such an honor. For example, who led all left wingers in defensive point shares in 2011? Really, that guy? Yes, that guy. So there’s that. However, like assists, it’s the offensive point shares that show the separation between wingers and centers in total point shares. Just look at how that gap has grown over the years!
It is data such as this that shows that collecting as many world class and talented centers are the key to winning Stanley Cups. It certainly makes sense because they have to complete tape to tape passes, be the quarterback of the defense from the forward line and win faceoffs (easily the most underrated aspect in hockey). That results in your hockey team learning what it is like to generate offense as a team and developing a passing gene, play five-man team defense and control what occurs once play starts or resumes. That is why it is important that the Capitals make the right decision on Mike Ribeiro at the trade deadline or in the summer. More on that on next week’s blog post.
Once again, I would like to thank hockey-reference.com for this research. All charts and graphs are pro-rated to assume that an 82 game season were to occur in all of the last 25 years.

[…] line center to look like he can stay in Washington since the end of Sergei Federov’s career (which really matters, as we learned last week). He is 33 years old. He is a magician on the puck. He is 33 years old. He has freed up Nicklas […]
[…] thing straight. Martin Erat is not a terrible player (yes, that is my expert opinion). First, let’s review my post from a couple of weeks ago of what a top 6 forward should put up every se…. If you compare that to Erat’s career, he has been a top-32 right winger for six or seven of […]
[…] weeks ago, I tried to explain what the proper definitions are for a top six forward. What we learned was that if your top six forward does not give you 20 goals plus 25 assists if […]