Jamie Sabau/Getty Images
After the Rangers beat the Capitals 2-1 on February 17th, Washington Capitals beat writer Mike Vogel wrote a fantastic piece on how the Rangers were able to get their sleepy power play to work in eight seconds and score the game winning goal. If you watch that particular goal, it was the result of some beautiful passing that would have made the 2010 Capitals jealous, but everything started out with a clean win by Brad Richards on the faceoff dot. Even if Washington’s Jay Beagle was able to make it dirty, the Rangers would have had to set up their power play in a much more disorganized matter in order to gain possession and keep it in the offensive zone.
As an ex-high school lacrosse player, I know that if both teams know a thing or two about throwing and catching the ball (which my high school and I were never good at), winning the faceoff is the most important objective outside of scoring a goal and preventing the other team from scoring a goal. That is because winning faceoffs leads to teams gaining possession and territory for long periods of time. In men’s high school and college lacrosse, there is no shot clock, so teams are allowed to hold the ball in the offensive zone for as long as they want. As a result, a 30-second stall warning was implemented a couple of years ago for referees who feel like the offensive team is not showing any effort to shoot at goal. Even with this rule change, the stall warning is only used when the referee is in the mood. A shot clock would be perfect to make amateur lacrosse a more actively offensive game, but the cost for these devices for high schools would be horribly expensive. Some players at the high school level are not used to running along a football field for as long as a 60-minute game to also get accustomed to play at a quicker pace. As a result of this strategy of patient and boring lacrosse, having a player dominating the face0ff area is critical. On Monday’s men’s NCAA Division I championship game, midfielder Brendan Fowler won 20 of 28 faceoffs, including 13 straight to help Duke come back from 5-0 down to win 16-10. I never watched the game, but you can envision runners-up Syracuse’s confidence was drained so fast, they forgot that they were trying to win a lacrosse game. His performance gave him an astounding 64% faceoff percentage for the season and postseason MVP honors.
So what about faceoffs during an NHL hockey game? A hockey rink (85 ft. x 200 ft.) is close to four times less surface area than a lacrosse field (60 yds x 110 yds). Thus, faceoff attempts in hockey are consistently double that of lacrosse. Add the fact that players are trying to move and corral a puck on a slippery surface, gaining a possession and territory advantage becomes much harder. So do hockey faceoffs have the same impact for how good a team is as lacrosse faceoffs do? Using all the faceoff data from NHL.com since the 1997-1998 season, here is how team faceoff percentages are related to regular season successes:
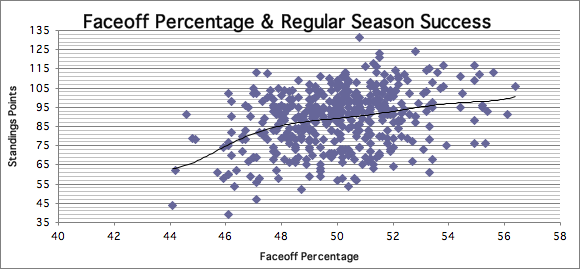
In general, teams that do well on the faceoff dot do well during the regular season. However, the data points can be seen as very inconsistent. When putting these charts together, I used a 6th degree polynomial trendline to generate the best correlation and most accurate equation possible for the data points. The higher the correlation, the more accurate the trendline is to the data points. For this chart, the correlation is only 11.7%. Sure, one would argue that 14 regular seasons worth of data would create more parity among the data points, but it is clear that the data shows that not every team that does well on faceoffs is a good hockey team and vice versa. Two teams that prove that statement are the Columbus Blue Jackets and the Pittsburgh Penguins.
Columbus has only made one playoff appearance since their franchise’s inception in 2001, yet they have been ranked in the top-10 faceoff percentage in four of the last five years. Having great faceoff specialists like Manny Malhotra, Derek Mackenzie, Antoine Vermette and Sammy Pahlsen over the years will do that for you. Even though Ryan Johansen has not been living up to his “4th overall pick in the draft” billing, he is off to a good start with his faceoff numbers. However, outside of Vermette, not a single player on that list can be counted on to set the place alight offensively.
With the Penguins, their start to faceoff futility began in the 1999-2000 season and almost directly resulted in their dark years: when Mario Lemieux went past his prime, Jaromir Jagr sulked and left for more money better ventures, and Sydney Crosby was a pre-teen. Starting with that 1999-2000 season, Pittsburgh would finish in the bottom-10 faceoff percentage in eight of the next nine years. But even when the Penguins turned their fortunes around and made their first Stanley Cup in 16 years, they were dead last that year in faceoff percentage. Having Jordan Staal and Evgeni Malkin winning 42% and 39% on their draws respectively would do that for you. Their opponents, the Detroit Red Wings, were number one in faceoff percentage that year. However, it wasn’t until this year that Pittsburgh finally became a top-10 faceoff team. This is all thanks to Sydney Crosby’s 54%, Brandon Sutter’s 50.2% and Joe Vitale’s astronomical 61%. Even Evgeni Malkin is improving a little at 47%.
But since regular season success does not always lead to playoff success, we need another chart to see how well a team can do with great faceoff numbers. Can teams that perform well on the faceoff circle win the Stanley Cup? The following data points are from the entire 1998 Stanley Cup playoffs until the end of the first round of this year’s playoffs:
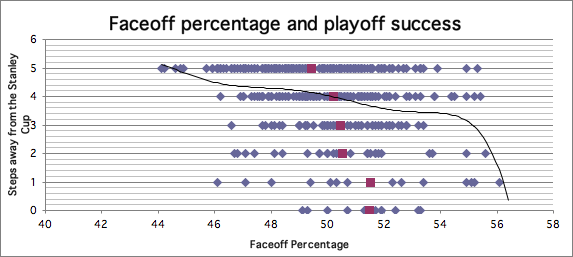
With all the data points being blue, it is clear that, once again, they are all over the place. All the bad faceoff teams seem to be gone by the time the second round of the playoffs (three steps away from the Stanley Cup) are over. For this year’s Stanley Cup playoffs, the Ottawa Senators are the only team with less than a 50% faceoff percentage to make it past the first round and they couldn’t advance any further. However, the numbers go crazy from here on out. Any trendline is going to look bad for a graph like this because there are only six values to chose from along the y-axis, but the correlation is 8.3%: just a 3% decrease from the regular season to the playoffs.
With that said, I have calculated all the averages for each step away from a Stanley Cup championship to see if that data will have a clearer picture. I have shown them in red on the graph above and in the chart below:
| Step from Cup | avg. FO% |
| Missed Playoffs | 49.41 |
| 1st Round | 50.19 |
| 2nd Round | 50.44 |
| Conf. Finals | 50.54 |
| Cup Finalists | 51.52 |
| Champions | 51.49 |
As you can see, the average team faceoff percentage increases from those that only make it to the first round to those that miss the playoffs. However, there is a very minimal increase with teams that make it to the second round to teams that make it to the conference finals. But there is close to a full percent increase from the conference finalists to Cup finalists. Finally, there is no increase among the champions and runners-up.
So, with all this data, I have come to the conclusion that teams that do well on the faceoff circle do well in the regular season and the playoffs. However, there are many discrepancies in the data and it is certainly not the end-all-be-all key to winning a Stanley Cup.

[…] The correlations for both graphs are outstanding at 29% and 17% respectively. To compare this to my last post on how team’s perform thanks to faceoff percentage, PDO is a more promising indicator for team success. Even though PDO records have been kept since […]