Vince Talotta/Toronto Star
It is finally here ladies and gentlemen. The Chicago Blackhawks and the Boston Bruins are battling it out for Lord Stanley’s Cup. The winner will be given the distinction of becoming the first team to win multiple titles during the NHL’s salary cap era (since the 2005-2006 season). Chicago, on paper, certainly looks like a team that deserves this honor with players like Jonathan Toews, Patrick Kane, Duncan Keith, and Brent Seabrook potentially finishing their careers as the some of the best players in their generation. Their 2010 teams and 2013 teams are also famous for having some of the deepest rosters in recent memory.
With Boston, however, it’s a different story. I am certainly not knocking off any of Boston’s potential success. Anytime you win two titles in a very short space of time, it should always be considered a massive achievement. As sports fans though, you have to consider the big picture and wonder if this is one of the better teams in league history, no matter what. Sure, Zdeno Chara can leave as one of the best defenseman in his era not named Nicklas Lidstrom, and Patrice Bergeron could be the most intimidating faceoff specialist since Rod Brind’Amour. After that, will we remember Boston’s grinding 4th line as the most intimidating? Will Brad Marchand, David Krejci, Dennis Seidenberg, or Tyler Seguin be remembered as some of the elite players of their era? Should Claude Julien even go down as one of the greatest coaches? They’re almost like the Tom Coughlin-led New York Giants. A few famous players like Eli Manning, Justin Tuck, Jason Pierre-Paul, and Michael Straham–but that’s it, and it’s not like any of those names are considered the greatest of all-time. So what has Boston been memorable at with Julien behind the bench?
One obvious trait is being among the best faceoff teams in the last three years and never hitting below 50% under the head coach’s watch. The other is their strong PDO for every season except for the 2009-2010 season, and we all know what happened then.
So what is PDO? It is the sum of a team’s shooting and save percentage during 5-on-5 situations, but that doesn’t explain what the acronym stands for. One could take wild guesses and guess that PDO stands for “Public Displays of Overallness”. However, PDO is actually named after a commenter’s alias under a Vic Ferrari (among the leading advanced statisticians in hockey) blog post. So far, PDO is given the same treatment as baseball’s BABIP (batting average with balls in play), in that it is a statistic to judge a team’s or individual’s overall luck. In BABIP, if a team or batter hits above the league average (generally between .290 and .300 every year), that means the team or batter is having lucky contact with the baseball and vice versa if the team or batter hits below league average.
For PDO, the league average is always at 1000 (all PDO numbers are displayed after being multiplied by 1000 to avoid using decimal points. If a team has a PDO of 1000, it also means that it is 100%). For example, say one team wins 2-1 with both teams scoring on even strength with 25 even strength shots each. The winning team will have a 96% save percentage and an 8% shooting percentage for a 1004 PDO for the game. The losing team will have a 92% save percentage and a 4% shooting percentage for a 996 PDO for the game. The average of those two PDOs will give you 1000. If teams reach above 1000, a team or individual is considered lucky and vise versa if the team or individual hits below 1000.
Some will argue that both BABIP and PDO are numbers that eventually prove how talented a team is over a long period of time. They will argue that at the end of the day, a great BABIP can determine whether or not a baseball player or team can make hard contact on the baseball and drive it past the infield. As a result, a team or individual that can consistently shoot accurately and play great defense can have a strong PDO. This is certainly a good point as Chicago is the 3rd best team in PDO this season. Even though Boston is only 14th in PDO, they too are above 1000 for the year. With that said, eight of the top nine teams in PDO could not advance out of the first round of this year’s playoffs. Only Buffalo and Vancouver have been able to keep their team PDOs above 1000 in each of the last six seasons and the New York Islanders are the only team to have their PDOs below 1000 during that span. So is PDO a statistic to measure luck, or a statistic to measure talent? Let’s start by taking a look at these two graphs:
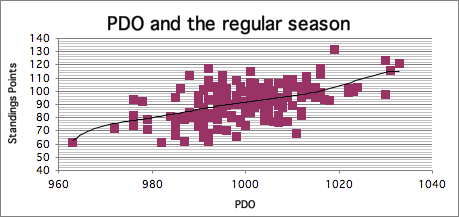
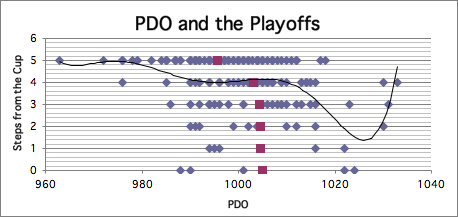
As the two graphs show, PDO turns out to be a great indicator for how teams do during the regular season, but it is not the best indicator for how teams do in the playoffs. The correlations for both graphs are outstanding at 29% and 17% respectively. To compare this to my last post on how team’s perform thanks to faceoff percentage, PDO is a more promising indicator for team success. Even though PDO records have been kept since the 2007-2008 season and faceoff percentage records have been kept since the 1997-1998 seasons, the correlation for faceoff percentage and regular season success since the 2007-2008 season was only at 15%. As the averages from the playoff success graph show from above, PDO was very poor among all non-playoff teams with an average 995. However, teams that made the playoffs show little to no difference amongst where they were eliminated in the playoffs. So why do people get this perception that PDO is a luck-based statistic?
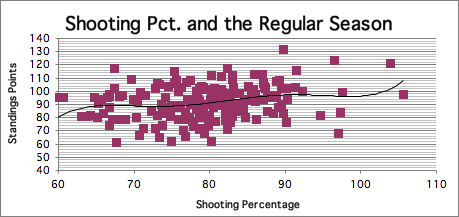
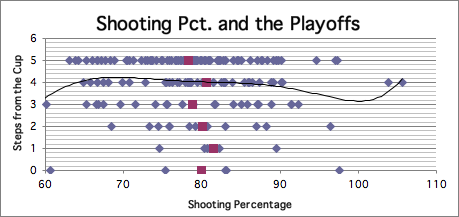
Hmm, I think we found the answer! For the regular season, correlation for shooting percentage is only 8% while the playoff correlation is a ghastly 2%. Shooting percentage has been the hardest thing to predict in hockey as a one percent difference can affect the outcome of a team’s or player’s season. Shots per game is a statistic that players and teams can control with their effort and style of play, but shooting percentage is a statistic that may not be controlled based on how the opposing goalie or team’s defense performs every night and which opponents they play in a given season.
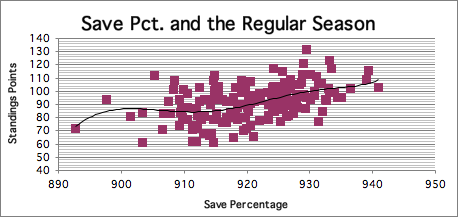
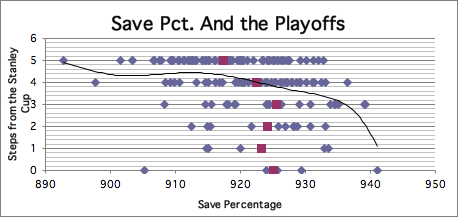
The subject on opposing defense and goaltending leads us to save percentage and how it leads to team success. As you can see, this number is a much better indicator of how PDO can be a talent-based statistic. Teams with great defenses and goaltending in 5-on-5 situations clearly do well in the regular season. However, it is not completely clear that it will translate to any advancement beyond the first round of the playoffs. With that said, the regular season correlation for save percentage is 24% while the playoff correlation is 14%.
So as you can see, PDO deserves to be considered a luck-based statistic because teams with bad offense don’t necessarily mean they are a bad hockey team. However, teams with bad save percentage almost always perform poorly. As a result, PDO also has the potential to be a talent-based statistic as well. Another conclusion that we always seem to come back to is this: anything can happen in the playoffs.
