
from DCSportsDork
Welcome back readers. A new mega-edition of the Nerdy 30 is upon us after taking a week off from my trip to Vancouver. The city was amazing despite it being rainy the majority of the vacation and I was able to meet so many new and familiar faces at the annual Vancouver Hockey Analytics Conference at Rogers Arena.
The event lasted up until the Canucks had to kick us out to get ready for their nationally televised showdown with the Pittsburgh Penguins, but a packed audience and I were treated to all-you-can eat breakfast, lunch, morning skates from both the Canucks and Penguins and many fascinating presentations from great presenters. The slides and videos from the conference can be found here and a wonderful full review by Curtis Leblanc of the event can be found here. Every presentation had it’s own share of insightful thoughts and cover a variety of topics. Like I mentioned at the Rochester Analytics Conference, getting new data points and tracking is the way to go in the near future and there is clearly a sense of eagerness to get that information out to the public. But not all can be built in six months time, let alone in a day.
Until then, it is more hockey watching, more enthusiasm about learning more about the game I love and more Nerdy 30 rankings. The Flyers have been knocked off since their “death nail” game against the Toronto Maple Leafs last week and you can find last week’s rankings under the following links.
30. Colorado (82-game Standings Points Pace: 51 points, Last Week: 30)
29. Arizona (Pace: 72 pts, LW: 29)28. Vancouver (Pace: 76 pts, LW: 28)27. New Jersey (Pace: 75 pts, LW: 27)26. Detroit (Pace: 77 pts, LW: 26)25. Buffalo (Pace: 80 pts, LW: 25)24. Dallas (Pace: 76 pts, LW: 24)23. Philadelphia (Pace: 84 pts, LW: 23)
The Colorado Avalanche are still a bad hockey team. That has been a given since the very early stages of this NHL season. But what has been perplexing is how historically bad they have become. It has been odd because the ethos of this franchise during the Patrick Roy era is how much they have been able to play beyond what the underlying numbers suggested and surpass expectations.
Under new head coach Jared Bednar, not only have they been crashing back to Earth, but the Avalanche has had their PDO fall as fast as their namesake. For those not in the know, PDO is combined on-ice shooting and save percentage while playing 5-on-5 hockey. Not since the Florida Panthers during 2013 lockout-shortened season has an NHL team hit below a PDO of 97. However, Colorado has been threatening to go below that mark the majority of this season. Thanks to winning three of their last five games, their PDO has now climbed to 97.28. However, that is still the fourth worst combined percentage in the ten-year span of collecting such data.
Meanwhile, the Flyers are struggling mightily to score goals for the second straight year. Along with Steve Mason having the ghosts of Columbus Blue Jackets seasons past and Michael Neuvirth overthinking that he’s a long-term starting goaltender again, Philadelphia’s PDO has dropped to 97.8. That mark is 14th worst in the past decade. So the question that these two eliminated teams want to ask is, when does the pain and suffering end? It turns out, it might last longer than they would like.
What I have done is collect all the on-ice shooting and save percentage data as well as the expected on-ice shooting and save percentage data (also known as xSh% and xSv%) for all 15 teams that are currently (Flyers, Avalanche and Bruins) or previously had a PDO less than 98 and compared that to their on-ice percentages the following season.
Understandably, the sample size is so small that the correlation will not be ideal but in general, on-ice percentages are expected to improve, but not to the level where NHL teams can become league average within the span of a year. Only three of the 12 teams with two-season data went on to record a PDO above 100 the next campaign and their xPDO only increased to a small percentage because their year of misery before hand usually (all but the 2009 Avalanche, 2013 Devils and 2012 Islanders) started below 100 as well. While xPDO isn’t the ultimate indicator of true talent for an NHL team, it is a better indicator as to whether expected goals have been the cause of their lack of talent or not.
| Data from Corsica | |||
| Statistical Category |
correlation | avg. Change | median change |
| xSv% | 69.7% | 0.02% | 0.03% |
| xsh% | 56.7% | 0.22% | 0.16% |
| Sv% | 42.3% | 0.90% | 0.61% |
| PDO | 34.3% | 1.75% | 1.05% |
| xPDO | 20.2% | 0.25% | 0.36% |
| sh% | 3.3% | 0.84% | 1.34% |
When it comes to more obvious data, on-ice save percentage has been the among most likely statistical categories to increase and could improve somewhere between 0.61% and 0.90%. That is not the biggest of surprises because it can be quite easier to replace a goaltender or a coach that has more structured systems in place than replacing 18 skaters that may or may not be able to score goals. Along with that, expected shooting and expected save percentage are the two categories that surpass save percentage as the items most likely to improve, but both numbers are only expected to increase by much smaller amounts. Finally, while shooting percentage has the ability to have the biggest changes, its ability to predict how much that change is is the least likely.
If this year’s Bruins pull it off, they would only be just the second NHL team in the past decade with a PDO of worse than 98 to make the playoffs. That previous team was the 2010 Ottawa Senators, who had a 24-year old Brian Elliott as their starting netminder with Jason Spezza, Mike Fisher, Milan Michalek, a 36-year old Alexei Kovalev and a 37-year old Daniel Alfredsson as their core pieces. Oh, and Erik Karlsson was just a 19-year old rookie waiting to catch the hockey world on fire and General Manager Bryan Murray traded the opportunity to pick Vladimir Tarasenko in that summer’s entry draft to pick up David Rundblad as a playoff rental. The next year, no one on the team racked up 60 points, Elliott was still terrible in net and their wasn’t a single big name forward that played over 67 games for the Senators due to injury or trade. Corey Clouston was fired as head coach and the Senators have been in their on-again, off-again fog ever since.
Every other team in the league that has experienced a PDO-stricken season like this has usually gone on to pick a franchise-altering player (Steven Stamkos and Connor McDavid being the biggest examples) or has acquired a core piece within the top ten of the entry draft or by trade (what-up Cory Schneider?!). Amazingly, only five of the 12 two-season teams fired their coach afterwards, but some of those teams were either on year one with a new head boss or had a spectacular season the year before their demise (2013 Devils being the biggest examples). So their you have it Flyers and Avs fans. You’re not going to be good next year but you should be able to pick up someone good in the long term this summer. That was a bit long winded, but it’s a topic I have been curious about all season, especially if the Hurricanes hit this tier once again.
- 22. Winnipeg (Pace: 80 pts, LW: 22)
- 21. Carolina (Pace: 84 pts, LW: 21)
- 20. Tampa Bay (Pace: 90 pts, LW: 20)
- 19. Florida (Pace: 86 pts, LW: 19)
- 18. New York Islanders (Pace: 90 pts, LW: 18)
- 17. Ottawa (Pace: 101 pts, LW: 16)
Somehow, through all the underlying numbers that suggest otherwise, the Ottawa Senators keep on rolling. While going 6-1-1 since the trade deadline, they only outscored the opposition 23-17 and should have been outscored themselves 19.5-21.9 according to Corsica. This time around, Ottawa’s goaltending has been shining through during this winning streak.
Since returning to the team on February 11th, Craig Anderson has posted a save percentage of 94.1% in 11 games. Throughout the course of the season, Anderson’s season totals now come to a 66.7% quality start percentage, a goals against versus league average of 81 and a 93.0% save percentage in all situations in 30 games. That being said, Mike Condon has played in Ottawa’s remaining 10 games since that February 11th cutoff. So clearly, head coach Guy Boucher is taking a two-goalie approach to the season while easing Anderson back into NHL level competition since being with his wife during her battle with cancer.
Along with Ottawa’s major surge in that department, the team’s power play has exceeded expectations as well. While the Senators are performing at a 17.7% clip on the man-advantage, they have converted on five of their last 23 opportunities. That being said, expected goals only has them scoring on 2.16 occasions according to Corsica. Plenty of that has been due to their season-long issue of not generating high quality chances. All season, only Colorado and Montreal have generated a lower number of scoring chances per hour than Ottawa’s 15.9 on the power play. The ringleaders of that unit have been Mike Hoffman (12 goals, 10 assists) and should-be hall of famer Erik Karlsson (2 goals, 21 assists). Hoffman’s qualities on the man advantage are now becoming world class thanks to his eighth best individual shot attempt rate among forwards with 300 power play minutes over the past three seasons. Meanwhile, Karlsson’s 61 assists and 30 primary assists are tops among all defensemen during that same span. If the rest of the forwards can pitch in, especially Bobby Ryan, this unit should be able to be scary come playoff time. Otherwise, more lucky charms will need to collected during St. Patrick’s Day for them to do anything worthwhile in the playoffs.
- 16. Calgary (Pace: 97 pts, LW: 17)
- 15. St. Louis (Pace: 93 pts, LW: 15)
- 14. Anaheim (Pace: 98 pts, LW: 14)
- 13. Nashville (Pace: 95 pts, LW: 13)
There was a period where the Predators looked like they were going to be on the outside looking in when it comes to playoff positioning. But after going 7-2-2 in their last 11 games, it will be safe to say that Nashville shouldn’t have anything to worry about the rest of the season. Filip Forsberg has been a part of their resurgence and there’s no denying his credentials anymore as a bonafide star. With Victor Arvidsson and Ryan Johansen, the trio form one of the better top lines in the NHL.
Now during their 11-game run, all Predators games have been quite zany. Only three times during that span has Nashville scored three goals or less and they scored on nine of their 31 attempts on the power play. That being said, the opposition scored 32 times, including 10 of Nashville’s 19 penalty kill attempts. This includes a game in which the Los Angeles Kings won 3-2 thanks to scoring on all three of their power play opportunities.
Some of the ills of the Predators during this successful run of form have been the weaknesses of this team all season. Their penalty kill has been below 80% for the whole season and plenty of that has to due with the still-sketchy goaltending of Pekka Rinne. While Nashville is in the middle of the pack in on-ice suppression while a player short, Rinne’s save percentage is at 85.9% in those situations. Even though penalty kill save percentages can fluctuate with each individual goaltender due to the small sample sizes each season, Rinne’s issues have been more consistent. If this season were to end, the veteran netminder will have the fourth worst save percentage among goalies with 750 shorthanded minutes in the last four years and it will be the third time in those four years where he will have saved less than 87% while a man down.
It also seems that the personnel might need some tweaking to do. Vernon Fiddler has not provided Nashville any shot suppressing while shorthanded while Mike Fisher looks like a shell of himself in that unit as well. If you remove them and maintain the usual suspects at forward in Forsberg, Austin Watson and Calle Jarnkrok, you have Arvidsson and Johansen next up based on time on ice. That’s not ideal to have all top line forwards to contribute heavy minutes on the penalty kill. While that is noble to have all your most skillful playing on the penalty kill, that is why fourth line forwards exist on your hockey team.
This leads to the last point. Nashville has struggled all year to get scoring depth and two-way contributions beyond their top six forwards. P.A. Parenteau was supposed to come on to provide such depth, but so far Peter Laviolette is struggling to find the perfect linemates for him. Kevin Fiala has proved that he has potential as a future top six forward, but the 2014 first round pick only has 12 points in 43 games. Laviolette is already limiting ice time to display his fourth line that has been a complete hodge-podge. Of late, it has been Cody MacLeod, Watson and the poo-poo platter that is Fiddler, Cody Bass and Harry Zolnierczyk. That simply isn’t good enough to make it far into the postseason and David Poile will have to find a way to address this problem over the summer.
- 12. Los Angeles (Pace: 88 pts, LW: 11)
- 11. Chicago (Pace: 111 pts, LW: 10)
- 10. Edmonton (Pace: 97 pts, LW: 12)
- 9. Toronto (Pace: 93 pts, LW: 8)
Meanwhile, it is getting about as dark as their home uniforms for Los Angeles and it doesn’t look like there’s an end in site. Since Feberuary 5th, the Kings have gone 7-8-3 and have been outscored 41-51. However, their expected goal totals during that span were actually 55.7-46.4. It’s a never ending story for L.A. Their puck possession is the envy of everyone in the NHL, yet they can’t capitalize on their opportunities.
Along with that, anyone beyond Peter Budaj has not contributed positively in net. Jonathan Quick has returned from injury and is doing the best he can to get the Kings back into the playoffs, but their questionable trade for Ben Bishop becomes even more I.Q. sapping every outing in which he saves below league average.
To top it all off, we are heading into the last month of the season and Los Angeles only has two 20-goal scorers and 4 10-goal scorers. Jarome Iginla has contributed solidly on the new top line with Marian Gaborik and Anze Kopitar, but who knows if that will be enough to free up the rest of the team.
If the Kings miss the playoffs, it will be their second time they have done so in three seasons. Is it genuinely time to let Darryl Sutter walk no matter how successful his system is? If so, is it time for a fresh rebuild? Can Adrian Kempe join future restricted free agents Tyler Toffoli and Tanner Pearson in leading a retool instead? Or is this just a quick fix where the Kings sign someone like T.J. Oshie because they might have as much as $4-$6 million in cap space for a forward and a backup goaltender after resigning all RFAs? Either way, nothing sounds ideal in Los Angeles for them to return to glory unless something dramatic happens to the construction of this team in the summer. And this is even taking into account that they might still make the playoffs.
- 8. Montreal (Pace: 101 pts, LW: 9)
- 7. San Jose (Pace: 107 pts, LW: 7)
- 6. Boston (Pace: 95 pts, LW: 5)
And just like that, Boston is back and possibly in the mix for a potential Stanley Cup birth. They have maintained their league-best puck possession all year, but have now added potent goal-scoring into their arsenal since swapping Claude Julien for Bruce Cassidy for head coach. Since that fateful day on February 9th, the Bruins have gone 12-4-0 and have outscored every opponent 62-39.
During that span, eight forwards have gone on to average half-a-point per game, including the newly acquired Drew Stafford. Brad Marchand has also solidified himself as the joint-leading goalscorer in the NHL with 37 all thanks to his 14-goal barrage in those 16 games. It shouldn’t be a surprise anymore to see the agitating mite from Halifax be among the best players in the world thanks to his contributions with Canada at the World Cup of Hockey and the fact that he is one-third of the best forward line the NHL with David Pastrnak and Patrice Bergeron. What is newsworthy is how Bergeron is joining in on the fun to the tune of four goals and 19 assists in that 16-game span.
Along with that, Cassidy decided to temporarily move Pastrnak into the second line with David Krejci while David Backes returned from injury to play on the top line. The results were tremendous and it allowed Boston to unleash two scoring lines instead of one while hoping and praying with the remaining three.
It’s not like Boston has changed that much to the way they play at even strength or even on the power play (12 goals in their last 44 opportunities). It’s just that their shooting percentages have skyrocketed to the tune of 9.9% and 15.1% in those respective situations. Getting Stafford and having him continue to contribute will be massive for Boston’s Stanley Cup hopes, but this team will need more than him, Backes, Pastrnak, Bergeron and Marchand to step up. Once you eliminate these names within the forward ranks, you are looking at Ryan Spooner at 36 points, followed by prolific goal scorer Dominic Moore with 20. If you did not notice the sarcasm in that last sentence, I don’t know what to tell you. Along with that, it’s looking quite difficult to find a defenseman beyond Torey Krug and Zdeno Chara that will hit 20 points this season.
Things are looking up for the Bruins now. They have scored three goals or more in 12 of their last 16 games while only doing so 26 times in their first 55. Along with that, their 2.83 expected goals per hour in all situations in the first 55 games has improved to 2.92 per hour. For them to make sure they can hit elite levels of offensive output, they need to pursue hitting the 3.2 mark and see if that can translate into actual goals.
- 5. New York Rangers (Pace: 105 pts, LW: 6)
- 4. Pittsburgh (Pace: 114 pts, LW: 4)
- 3. Columbus (Pace: 114 pts, LW: 3)
- 2. Washington (Pace: 115 pts, LW: 2)
- 1. Minnesota (Pace: 109 pts, LW: 1)
It’s pretty fair to say that these two teams have to be joined at the hip. After all, both teams currently or used to employ Bruce Boudreau as their head coach and both teams have relied on insane amounts of PDO for them to be the two best teams in these Nerdy 30 rankings throughout the majority of this season. However, both teams have been struggling since their respective bye weeks and are now being threatened of losing their divisional leads.
For Minnesota, they have now lost six of their last eight games since the trade deadline and have only scored more than three goals twice while giving up three or more in their last five games during that span. Still, the Wild have actually been out-attempting teams 62.8-51.2 per hour at even strength during that span. That is a welcome sign considering that they have been below league average in both shot generation and shot suppression at even strength. Along with that, their expected goal for percentage in all situations is still only bettered by Boston all season. If anything, Boudreau’s teams now need to find new shooting areas where they can exploit defenses and score from. All season, the Wild have been very successful at attacking the right side of the offensive zone but not the areas in front of the net on volume. Meanwhile, they have been among the best in preventing teams from attacking the middle all year. Unless you want Minnesota to maintain their current puck possession while shooting at much better rates, I wouldn’t worry about the Wild so much.
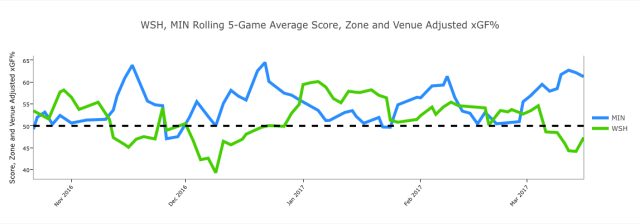
5-game rolling chart from Corsica
Washington on the other hand is getting into a dark place. Even though they have done solidly from an un-adjusted standpoint at even strength, the Capitals’ defense has given up over 56 adjusted shot attempts per hour post-bye week. They have also given up 51 penalty killing opportunities and have given up -15 power play/penalty kill differential during this 14-game span. While the goal count has only been a 9-8 deficit, that amount of time while shorthanded will tire out any team in the long run and will allow teams to penetrate a defense much more easily.
Lastly, Andre Burakovsky has to come back from injury. It is all well and good to see phenom prospect Jacob Vrana get some game time, but it is getting more evident that he is dragging the once-potent third line down at even strength. As a result, opposing defenses are attacking the second line followed by the top line that has already shown some wear and tear all season.
Long term, Barry Trotz has to consider playing Alex Ovechkin as a second line or third line option as early as this October just like the Wild have done so with Eric Staal, the Kings have done so with Jeff Carter or the Rangers have done so with Rick Nash. It shouldn’t be insulting to put such a legend down the pecking order for the team, but it goes to show how fast those power and shoot-first style of forwards age as soon as they turn 30.
Both Pittsburgh and Chicago are flawed teams when cooler heads prevail, but these two rivals to the Caps and Wild, respectively, have scarred them for so long throughout their history that it will take seismic levels of mental strength for them to surpass them if their respective enemies match up in the playoffs.
