
Dominic Disaia/ESPN
It has been a sporting tradition in the United States to fill out an NCAA Men’s Basketball Tournament bracket every year and join various pools. I, however, just can not do it anymore. Some zaney teams have made it to the final four the last handful of years, but I can not help but feel like they are phoneys because if it was not for such a huge amount of freshman leaving for the NBA every year, they would have never made it into the sweet sixteen. That’s why I have treated the Stanley Cup playoffs as my proverbial March Madness instead. In fact, research has proven that the Stanley Cup playoffs generate way more parity than during March Madness. For the second straight year, I was able to correctly predict who would win the Cup, so I feel like I need to share you all my secrets for filling out your bracket.
Never ever ever ever ever ever ever ever ever have a messy goaltending situation. EVER!!!!
This is the soul reason Tampa Bay lost in the first round. When Ben Bishop was out for the playoffs with a right wrist injury, the Lightning went from having a borderline Olympian in net, to someone that might have made Dwayne Roloson wish he was still playing in the NHL. Quite frankly, Anders Lindback was a disgrace this year by saving only 89.1% of his opponents shots and recording 0.088 point shares per 60 minutes. It should come as no surprise that Lindback could not step up against Montreal in round one.
Plenty of other teams were struggling to stick with one goaltender during the playoffs. Steve Mason missed the first two games for Philadelphia because of an apparent concussion and Anaheim couldn’t decide if Jonas Hiller, Fredrik Anderson or John Gibson was their best goaltender until they got knocked out in round two by Los Angeles. The icing on the cake was what happened in San Jose. After having a terrible game four and game five, head coach Todd McLellan thought it was a good idea to replace usual starter Antti Niemi with Alex Stalock for game six. The experiment failed miserably and the Sharks would blow a 3-0 lead and lose in the first round. Despite having a mediocre season being pulled six times during the regular season, Niemi still played 64 games to Stalock’s 24. Next year, McLellan better decide who is his guy, or it will be more of the same next year.
Corsi and Fenwick Close matters
Including this year, there has been a constant theme with this category in terms of picking a Stanley Cup champion. Habs Eyes on the Prize, Montreal’s SB Nation blog, posted a fantastic piece about how puck possession translates to playoff success. Corsi may include many factors that could skew a rating that Fenwick close hopes to eliminate, but it is important to note that since the statistic was made public during the 2007-08 season, the 2012 Detroit Red Wings are the only team to lead the NHL in Corsi and not make the conference finals. As for Fenwick Close, another 2012 team was the only team not to make the conference finals, only it was the Pittsburgh Penguins this time. In fact, neither of the top three in both Corsi and Fenwick that season made it passed round two (Detroit, Pittsburgh and St. Louis). That’s what you get for having the eighth seeded Kings and sixth seeded Devils playing in the Stanley Cup final.
Fenwick Close might be considered the consensus choice for determining an NHL team’s future success, but the so called skewed factors could include holding on to multi-goal leads. There were plenty of playoff games that included teams seeing their two or more goal leads slip away and Fenwick Close may not be enough to explain that. So let’s see if our set of playoff teams have that much of a difference between Corsi and Fenwick Close.
| Playoff Team | Corsi | Fenwick Close | Difference |
| Montreal | 46.7 | 48.4 | 1.7 |
| Pittsburgh | 48.7 | 50.2 | 1.5 |
| Dallas | 50.5 | 51.8 | 1.3 |
| San Jose | 53.7 | 54.9 | 1.2 |
| NY Rangers | 52.4 | 53.6 | 1.2 |
| Columbus | 49.9 | 50.7 | 0.8 |
| Tampa Bay | 51.0 | 51.7 | 0.7 |
| Colorado | 47.0 | 47.3 | 0.3 |
| Anaheim | 49.8 | 50.0 | 0.2 |
| Boston | 53.9 | 54.1 | 0.2 |
| Minnesota | 48.6 | 48.7 | 0.1 |
| Los Angeles | 56.8 | 56.7 | -0.1 |
| Detroit | 51.5 | 51.2 | -0.3 |
| Chicago | 55.5 | 55.2 | -0.3 |
| St. Louis | 53.1 | 52.2 | -0.9 |
| Philadelphia | 50.0 | 48.2 | -1.8 |
For the exception of Philadelphia, all the teams in this chart either have shown marked improvement from their sub 50% corsi to their fenwick close or both their corsi and fenwick close are among the best in the NHL. No matter which number you use, this favored Los Angeles and Boston to make it to at least the final steps of the playoffs. Flyers fans should not have been happy witnessing that piece of evidence.
Kill off penalties or be killed
George McPhee can say all he wants about the goaltending, but his shambolic failure to ever develop a solid core of defenders was why his teams always under-achieved and why he had to be fired. Proof for this is that from the 1997-98 season onwards, Washington has only had three years in which they have had a top ten penalty kill (1998, 2000 and 2011). Meanwhile, the complete opposite is almost true for every Stanley Cup champion during that time frame. Only the 2006 Hurricanes, 2009 Penguins and 2011 Bruins and this year’s Kings did not win the Cup with a top ten kill. This was a definite advantage for the Blues, Rangers, Canadiens, Penguins, Sharks, Flyers and Bruins. Despite not having a strong penalty kill, the Kings still finished 11th at 83.1%. If Los Angeles wants to repeat, they will have to shore this up next year.
Do all six defensemen have a major role?
This next piece of criteria that needs to be discussed is not so much a data-driven fact, but one that is driven through the eye test. This concern applies to teams like Boston and Minnesota that think it is a good idea to put out their best defenseman for more than 30 minutes per playoff game. This usage certainly makes it valid how valuable one defenseman is to a playoff team, but as the playoffs go further along, you will see some of the most successful teams that not only have one world class defensive pairing, but great second and third pairings as well. I still have visions of Johnny Oduya, Nicklas Hjalmarsson and Nick Leddy kicking ass for Chicago last year and I used to have the same visions to what teams like St. Louis had this year. It was why I had them as my pre-season cup favorites and it is why I am in such a state of misery thinking about the Capitals. In the Stanley Cup finals, people can talk all they want about Ryan McDonagh and Drew Doughty all they want, but it’s people like Jake Muzzin, Matt Greene, Alec Martinez, Anton Strallman, Marc Staal and Dan Girardi that got them this far.
The last 30 games in the regular season matter
See the end of my off-season post for my explanation.
Let Simple Rating System be your friend, not your enemy
If you followed that same post, you will notice that I called Pittsburgh “one of the worst 109-point teams of all time”. So I did some extra sleuthing to see if I am correct. This next chart lists all the teams since the 2000-01 season (the first year the NHL had 30 teams) that have put up 106 standings points and a Simple Rating System below 0.5. Simple rating system is a score that sports-reference.com uses to determine how good a team is based on strength of schedule and average point difference.
| Season | Team | Standings Points | SRS | Playoff Result |
| 2003 | New Jersey | 108 | 0.48 | Champions |
| 2003 | Philadelphia | 107 | 0.43 | Second Round |
| 2006 | Buffalo | 110 | 0.50 | Conference Finals |
| 2006 | Carolina | 112 | 0.29 | Champions |
| 2006 | Nashville | 106 | 0.32 | First Round |
| 2007 | New Jersey | 107 | 0.03 | Second Round |
| 2007 | Dallas | 107 | 0.44 | First Round |
| 2008 | San Jose | 108 | 0.47 | Second Round |
| 2009 | New Jersey | 106 | 0.38 | First Round |
| 2009 | Washington | 108 | 0.27 | Second Round |
| 2010 | Phoenix | 107 | 0.34 | First Round |
| 2011 | Pittbsurgh | 106 | 0.43 | First Round |
| 2011 | Philadelphia | 106 | 0.40 | Second Round |
| 2011 | Washington | 107 | 0.27 | Second Round |
| 2012 | NY Rangers | 109 | 0.46 | Conference Finals |
| 2013 | Boston* | 62 | 0.44 | Cup Finals |
| 2013 | Montreal* | 63 | 0.46 | First Round |
| 2013 | Anaheim* | 66 | 0.43 | First Round |
| 2014 | Colorado | 112 | 0.40 | First Round |
| 2014 | Pittbsurgh | 109 | 0.47 | Second Round |
*=For the 2013 season, I included teams that have hit 62 or more standings points because that is the 48-game equivalent for 106 points.
So this table might have four teams that played in, at least, the conference finals in their respective season, but they all came out of the crummy Eastern Conference. In fact, only six of the 20 teams on this list come from the Western Conference. That conference simply has no time for teams that cheat their way to a boat load of standings points.
The curse of the President’s trophy
I’m sorry, but as a fan of the 2010 Washington Capitals, this has to be brought up every single year. Yes, Chicago might have won the Stanley Cup in 2013, but that was during a lockout season and they could/should have been knocked out by Detroit in the second round. Even if you include those Blackhawks, only seven of the other 27 President’s Trophy winners have won the Stanley Cup. So yes, Boston may have had the most complete team in the NHL in the regular season, but all it takes are a few injuries (oh hello, Dennis Seidenberg!!!), bad luck and a miserable opponent to play against to prevent them from winning the Stanley Cup. In this case, they had P.K. Subban, Carey Price and the Montreal Canadiens who were the miserable opponent…again.
The curse of the defending Champions
It is repeated at nausea by Mike Emrick and others, because it is worth repeating until your brainwashed. The 1997-98 Detroit Red Wings are the last team to repeat as Stanley Cup Champions. With the NHL being under a salary cap since the 2005-06 season, it has gotten harder for teams to keep their core group of players and develop any form of an All-Star team. Also, being a Stanley Cup Champion from the Western Conference is the worst.
Lucky number 125
As I mentioned in last year’s Stanley Cup playoff predictions post, if we were to add all the seeds together in all the Stanley Cup playoffs during my lifetime (since 1987), the average total will be close to 125. My co-worker and I both had brackets who’s sum total was close to that number. In fact, last year’s playoffs finished with a total of 123, not far from the previous average, and certainly not far enough to change that coming into this year. If the standings were under the old playoff qualification rules, these playoffs would have produced a whopping 139 total points. Instead, we have to use division seeds only, and this year’s total was 73, with a minimum score being 59. In other words, you get a sum that is, once again, typical of what you would see in the Stanley Cup playoffs every year. As for my bracket…
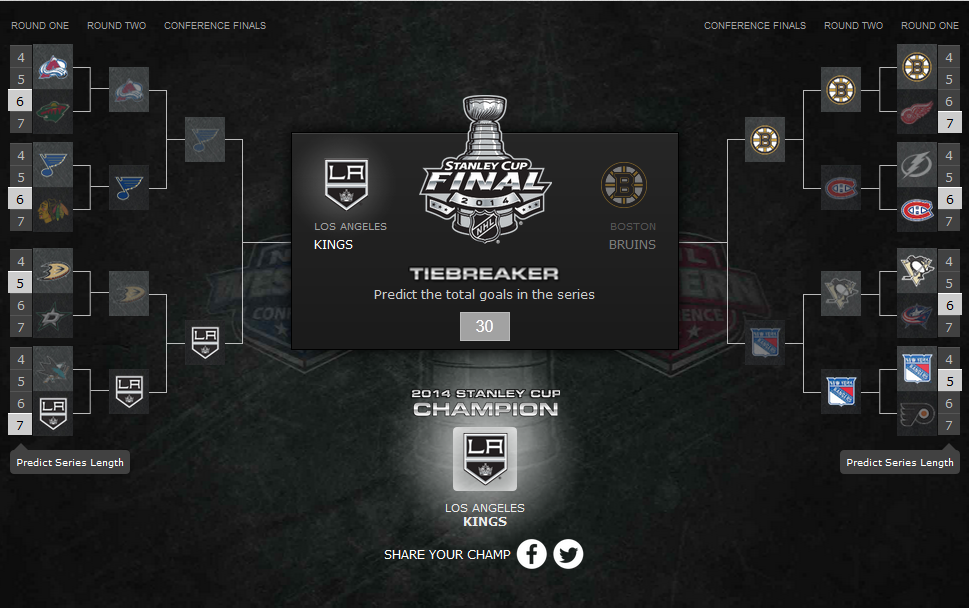
First things first, let the record show that I will never fall in love with my preseason prediction ever again. St. Louis just could not complete with Chicago’s speed as soon as David Backes got injured. My bracket’s parity score under the old system was 116 and 69 under the new system. All I needed to do was pick Chicago to get to the Conference Finals and I would have been able to reach the appropriate number of added seeds, but I had no idea how healthy Jonathan Toews and Patrick Kane were going to be coming into the playoffs. Clearly, that was a bad prediction. Oh well, on to next year!

Thanks Ben!